Search Engine Optimization – better known as SEO – is top of most marketers’ minds nowadays. To exist on the internet means to exist on page one of Google. And to do that, you must optimize your website for Google’s always-changing algorithms.
As a call tracking and business performance company, CallSource has knowledge of both the service of call tracking to help marketers and how SEO helps marketers as well. As such, there is a statement involving both of these that has to be made.
Call Tracking does not harm your SEO.
Call tracking and SEO working together; the rumor that call tracking harms your SEO is one of many myths about call tracking. Let’s dive into this topic and demystify this rumor to show that call tracking does not harm your SEO.
Call Tracking & SEO: The Beginning
In the earlier days of SEO, until a few years ago, it was always said that call tracking hurt SEO because of Google’s rule of businesses having a consistent NAP (name, address, and phone number) across all listings. Therefore, the consistency of a business’s information was key, and having multiple unique call tracking numbers on different listings was a big SEO no-no.
For example, if your main business line was listed on your website, but then you had different phone numbers in other business listings, Google would crawl all of these and negatively impact your SEO ranking because of the inconsistencies, making your business seem a bit less legitimate. As Google’s crawlers evolved, this practice was quickly stopped. This “fake fact” persists in the minds of folks who do not stay up-to-date in best SEO practices.
Call Tracking & SEO: Enhancements
Call tracking technologies, and SEO best practices have become more robust over the years, making these two work in unison much better than previously.
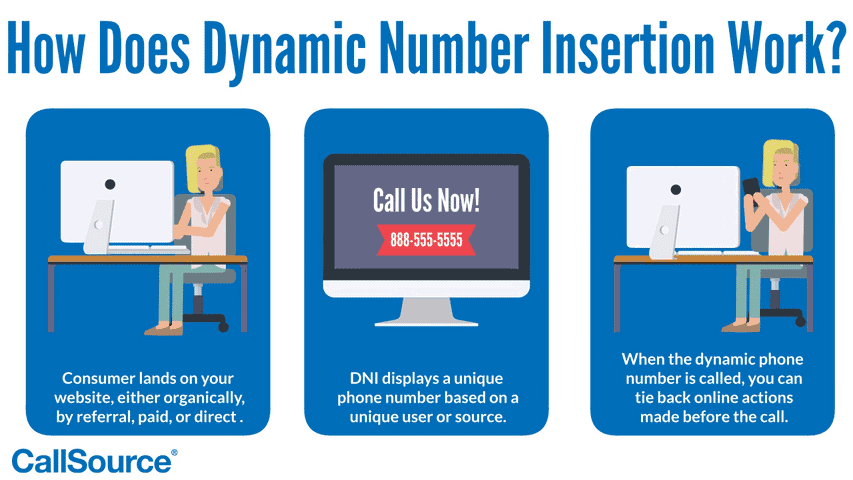
Dynamic Number Insertion
Call tracking is no longer strictly for static phone numbers – dynamic number insertion (DNI) has increased in popularity and its capabilities in the recent past.
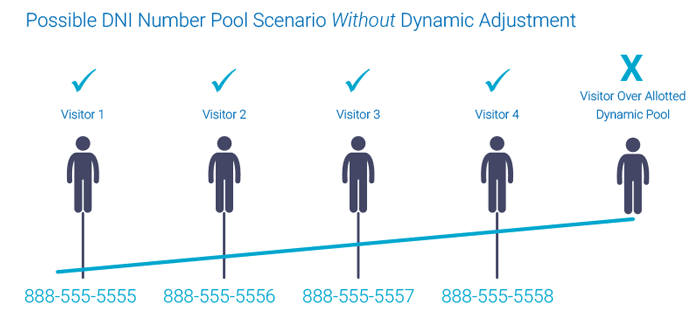
Dynamic number insertion is a form of call tracking that uses a script that leaves your main business phone number in the background for Google to crawl; DNI displays a unique call tracking number to each user landing on the page.
DNI doesn’t conflict with any of SEO best practices since the script masks the actual number tied to the business. DNI provides deeper analytics and insights into your marketing, tying online and offline attribution.
The Evolution of SEO
The older days of SEO practices could be labeled a bit like the Wild West.
Content was being created for search engines and Google’s crawlers, instead of being created for people. To rank higher, marketers were creating things simply to follow the “rules” of what search engines are searching for, rather than the relevance or quality of the content. Things like keywords and backlinks were of highest priority, so the value of these web pages suffered and did not always deliver truly helpful results to users.
This led to a lot of use of applying “black hat” SEO practices to try to get a website to rank higher in Google. HubSpot has a great, succinct definition of black hat SEO:
“Black hat SEO is a practice against search engine guidelines, used to get a site ranking higher in search results. These unethical tactics don’t solve for the searcher and often end in a penalty from search engines. Black hat techniques include keyword stuffing, cloaking, and using private link networks.”
It is because of these bad practices that were running rampant that has caused SEO to evolve to look at the bigger picture, rather than just specific things being ranked as higher priority without much other context. Content that is created for real people, instead of just for search engines, will end up ranking higher organically because of its relevance and usefulness.
Google’s Updated NAP Rules
Google’s most recent guidelines for representing your business on Google states: “Provide a phone number that connects to your individual business location as directly as possible, or provide one website that represents your individual business location.”
Google also notes that a local phone number is preferred over a central call center helpline number whenever possible and that you may use additional phone numbers on Google My Business websites and other local services.
What does this mean?
Add your call tracking numbers (local prefixes are best) into the business phone number listing and then place your NAP (direct phone number) into the additional phone number sections within Google My Business.
Find the full step-by-step process of how to use a call tracking number in Google My Business here.
Google My Business is how businesses manage their local results and the phone numbers displayed in organic search results. An interesting note from Google’s language is that a phone number or a website are required. While this isn’t 100% clear, it could mean that you only need one NAP (Name, Address, Phone) match to be validated (phone or website). Most businesses haven’t even been claimed, verified, or setup on listing sites such as Google My Business correctly, so make sure to take some time to complete the process.
Download the top 7 places to display your static call tracking numbers online.
Google My Business and Call Tracking
Google wants to optimize its search engines for the ultimate customer experience – so, rules aren’t quite as inflexible as they used to be.
Today, companies are using call tracking to improve their online and offline marketing and the customer experience. Call tracking; especially DNI, is imperative for businesses that advertise online and offline.
Get started with call tracking to improve your SEO and customer experience
You no longer have to be afraid of using call tracking and bettering your SEO for your business – the two are not mutually exclusive.
Ready to have someone reach out to you? We’ll have a representative contact you, or feel free to reach us today at 888.788.0123 to learn more.
Start tracking your inbound calls.
Get Call Tracking.
I want to talk to someone about utilizing call tracking at my business.


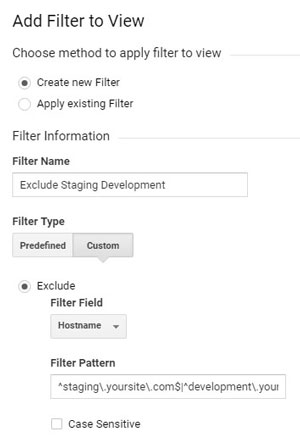
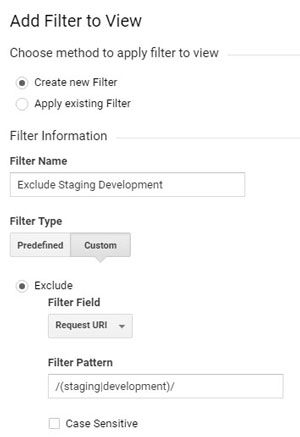 If you use a page for staging: