• Skip to primary navigation
  • Skip to content
  • Skip to footer
  • sales@callsource.com
  • Schedule a Demo
  • (833) 968-7768
  • Search Icon - Click to Search
CallSource

CallSource

Performance Management for Sales and Marketing

  • Automotive
  • Hearing
    • CallSource Hearing
      We want to help you grow your practice
    • Hearing Call Management
      Marketing Attribution | Call Volume | Opportunity Alerts | Call Analysis
    • Hearing Performance Management
      Phone Insights | Employee Performance | Call Coaching
    • Hearing Reputation Management
      Respond, Now! | Review Platform
    • Hearing Digital Management
      Complete Attribution Platform l Dynamic Number Insertion l Competitive Insight
  • Home Services
    • CallSource Home Services
      We want to help you grow your business
    • Home Services Call Management
      Marketing Attribution l Call Volume l Opportunity Alerts l Call Analysis
    • Home Services Performance Management
      Phone Insights l Employee Performance l Call Coaching
    • Home Services Reputation Management
      Respond, Now! l Review Platform
    • Home Services Digital Management
      Complete Attribution Platform | Dynamic Number Insertion | Competitive Insight
  • Pest Control
    • CallSource Pest Control Solutions
      We work with top providers
  • Industries
    • Other Industry Solutions
    • Dental
    • Call Management


      Track Inbound Calls l Discover New & Missed Opportunities l Industry Benchmark

    • Performance Management


      Score & Analyze Phone Skills l Call Coaching l Empower Employees

    • Reputation Management


      Aggregate Reviews l Improve Online Reputation l Respond, Now!

    • Digital Management


      Complete Attribution Platform l Dynamic Number Insertion l Competitive Insight

  • Vanity
  • Blog
    • Podcast
    • Events
    • FAQs
    • Knowledge Center
  • Company
    • About Us
    • Careers
    • The Company We Keep
    • Contact Us
  • Login
    • CS Reviews
    • EveryLead
    • Reporting

Digital Management

Don’t Be Afraid of Your Data: Why Data-Based Decisions Are Necessary for Your Business

November 1, 2018 by Cassie Ciopryna Leave a Comment

It’s time to trust data, not just your gut, when it comes to important business decisions.

It can get spooky out there in October.

Not only because of Halloween on the 31st.

October is the start of Q4 – the final quarter of the year also known for businesses as the sort of “make it or break it” time.

If you’re already ahead of your goals, then you may not be too worried. But if you have catching up to do, or are worried that a slower end-of-year season may skew your sales numbers, then you have some powerful decisions coming up that you’ll need to make.

It can be scary to look at your data when you’re unsure what to expect. But it is also necessary to make sound business decisions, and decision time for the coming year is upon us!

Accurate data › “Good” Data

While it’s always nice to share the company’s successes with your employees, it is also important to be accurate and transparent. Decisions shouldn’t be made only on what you hope for, but what the reality is.

You can’t rely on your “gut feeling” alone

A survey by Bi-Survey showed that 58% of respondents say their companies base at least half of their regular business decisions on gut feel or experience rather than being driven by data and information.

via GIPHY

Why is this?

Well, one reason cited is that half of the people simply don’t think they have access to the data that they need to aid in their decision-making.

Are you gathering data in the areas necessary to help your business make the right decisions?

It’s easy to continue doing things “as they’ve always been done” because it’s worked for you in the past. Yet, that is not a smart business move. There are always ebbs and flows, and the way business is done changes year over year. Simply staying stagnant is not benefitting your business grow and stand out. It is vital to put actual metrics to the decisions you are making in order for the business to improve.

Define and use your KPIs

In that same Bi-Survey survey, it was illustrated that 79% of respondents have a defined, standard set of KPIs in their organization, but only 36% are using them pervasively across the organization. This is obviously a major issue and an area for improvement for data-driven decision-making.

They noted: “best-in-class companies rely on defined and pervasively used KPIs much more than average and laggard companies.”

How do you make sure that your business is one of the best rather than just average, or behind the curve?

Define, create, and report on your KPIs!
It is impossible to create or check-in on KPIs without having data behind them. While you may think you need to work on one area over another, data may show something completely different. Perhaps it is the area that you think your employees are excelling in that actually need more attention. Without the proper data, you can’t make the proper decisions.

The scary truth of making decisions without data

Rob Enderle, a former analyst at IBM, wrote about a particularly awful incident that happened at his time there because of a decision that was made despite a lack of data.

In his article Data Analytics Will Fail If Executives Ignore the Numbers, he recalls when IBM decided to sell a business unit of the company, ROLM, to Siemens.

Although the IBM executive team commissioned research on the implications of this choice to determine whether or not it was a wise decision, they already made the decision before the research was done. Why?

Perhaps the executive team trusted their instinct that it would be a wise move and thought the data would reflect that, but when the research came out, it concluded that selling this business unit would be, as Enderle puts it, “a catastrophic failure for the unit.”

The unit ended up losing more money than IBM initially paid to acquire it.

The takeaway here?

Smart decisions are data-based decisions.

Although it can be scary to take a look at your data since it may not conclude what you were hoping for, wouldn’t you rather be wrong in your suspicions than wrong in your decision-making for your business’s health and prosperity?

Data-based decisions improve your business

Although we are close to Halloween, I don’t want to tell you only the scary stories. I’ll leave you with a happy ending so that the lesson here can be learned.

Let’s take an example from a business that everyone knows about and can look up to for best practices: Google.

Now, of course, I know you don’t have the manpower or budget that Google has to apply at your business and quite frankly – neither do most. Still, Google’s example showcases something that all businesses can do in their own way.

Google was curious to discover if managers were necessary for the workplace, or if everyone should just be responsible for their own work and productivity without anyone to report to. To find out, they put a project together to answer the question: “Do Managers Matter?” which they codenamed “Project Oxygen.

Once they started the project, however, they started realizing that managers do matter, and shifted their question to see what makes someone a good or bad manager.

Statisticians gathered over 10,000 observations about managers, across 100 variables from various performance reviews, feedback surveys, and more. They then coded the comments to look for any patterns.

Once those patterns gave them working theories, they then figured out a system to interview managers and gather more data to look for evidence to support those theories.

After coding and synthesizing the results of the in-depth interviews, they gathered their results (which they basically broke down into a list of eight qualities of a good manager) to incorporate into various training programs.

Laszlo Bock, Google’s vice president for “people operations” (aka Google’s human resources), noted in the New York Times article that outlined this whole plan, Google’s Quest to Build a Better Boss, “We were able to have a statistically significant improvement in manager quality for 75 percent of our worst-performing managers.”

Google’s “Project Oxygen” plan goes to show that even something as seemingly difficult to assign data to such as human qualities can be improved by using data to drive results.

Don’t let your business’s future become another scary story

As you are looking over your year-to-date results to determine your 2019 decisions, let data, not your intuition, be your guide.

Need help gathering more data to make better decisions at your business? CallSource wants to help you do just that. Schedule a time to talk to a specialist today and start making sound business decisions tomorrow.

Filed Under: CallTrack Tagged With: Call Management, Digital Management

The Top Advanced Reports to Look at in Google Analytics

October 8, 2018 by Kevin Dieny Leave a Comment

Consistently improve your marketing with essential data. The best reports exist to answer a specific question tied to your marketing.

Last week, we covered some of the basic, yet important, reports that you should be looking at in Google Analytics depending on the question(s) you are trying to answer.

Today we are answering more of these questions and which advanced Google Analytics report to view.

What makes a report advanced?

Advanced reports answer more specific questions and are also tied to organizations that are using specific functionality within Google Analytics. Generally, that specific functionality must be setup prior and needs to be aligned with the businesses unique KPI’s.

Is every advanced report important?

Every advanced report will be important to some businesses, but not all of them. The advanced capabilities of reports within Google Analytics allows for customization to match the needs of the business. Not every business needs to use every single report in Google Analytics.

How do I use the advanced reports?

Does the report provide insight that you are willing to use and make actionable? If a report is only a vanity metric – do not bother. If you cannot do anything with the data that the report provides – do not bother. Finally, if you do not trust the data in the report, it is also not useful.

Let’s See Some Advanced Reports.


Question: What events are firing on my website?

Why you might ask this question for your business:

  • You are using events to signal specific interactions are occurring on your website and want to measure everything is working as intended.
  • You are setting up goals that are based on events and want to know more about the events themselves.

Error Considerations:

  • Events are only as good as the conditions in which they were created. A poorly conceived event is not anyone’s fault but the owner or creator. You can have unlimited events, but do not get carried away. You do have limited Goals per property.
  • Events are personalized at every level: the categories, actions, labels, and values are all picked by the event creators. Make sure you have a reliable naming convention, otherwise things can be confusing and time consuming for lookups.

Advanced Reports

Behavior Reports Contain Events Focused Data

Note: Events require that you have setup events to fire and to have data.

  • Behavior > Events > Overview
  • Behavior > Events > Top Events
  • Behavior > Events > Pages
  • Behavior > Events > Events Flow

Question: What channels are driving the most goals on my website?

Why you might ask this question for your business:

  • You have set up goals and want to attribute those goals back to channels to find out which channels are driving those specific goals.
  • Your goals match to KPI’s and so you want to verify the return on your investments.
  • You understand that channels are often multi-touch and that it can require several channels before a goal is completed. Therefore, you want to measure various attribution models to determine success.

Error Considerations:

  • Cookies are what Google Analytics uses to track users over time and across channels. They are great in that they can persist for months, but they are susceptible to being deleted or duplicating the data since they are not 100% reliable.
  • Conversions are most reliable if someone visits a page and converts immediately. Between 1 – 7 days, the conversion reliability falls prey to cookie issues and being lost to browsers and changed devices. Between 7 – 28 days the conversion is still semi-reliable according to Google. Between 30 – 90 days you are looking at highly sampled and issue prone data. Any tracking solution that uses cookies suffers from these issues. This is why you see a lot of attribution tools that use the 1-7 or 28-day windows.
  • Unless you are on Google Analytics 360, you are most likely viewing sampled data and should consider all of the multi-channel funnel reports to be directional not precise.
  • Unless you know exactly what you are doing by setting up smart goals, they can be incredibly deceiving and misinterpret the goals you are actually trying to measure. Until the feature improves it is mostly a vanity metric.

Advanced Reports

Conversions Reports Contain Goal Focused Data

Note: Conversions require you to have setup goals previously and to have data.

  • Conversions > Goals > Overview
  • Conversions > Goals > Goal Flow
  • Conversions > Ecommerce > Overview
  • Conversions > Multi-Channel Funnels > Overview Report
  • Conversions > Multi-Channel Funnels > Assisted Conversions Report

Question: How are users navigating through my website?

Why you might ask this question for your business:

  • You want to improve the customer experience of navigating to the content they need.
  • You want to improve pages other than the homepage.
  • You want to understand what pages are getting people to click and go deeper into your site.
  • You want to remove barriers or find problems in calls to actions that are not helping people navigate to where they want to go.

Error Considerations:

  • Not every website has a blog, education, information, or tons of different pages. This means that a homepage might be the primary landing and lead collection page. The page paths might not be all that useful unless you have a business goal to get people to another page.

Advanced Reports

Behavior Reports & Conversions Contain Path Focused Data

Note: Conversions require you to have setup goals previously and to have data.

  • Behavior > Behavior Flow (Primary Dimension: Source/Medium)
  • Conversions > Multi-Channel Funnels > Path Length

Question: How effective is my social media at driving traffic?

Why you might ask this question for your business:

  • You have a social media strategy and want to evaluate how it is performing.
  • You want to know what social posts are generating higher quality traffic.
  • You want to determine which type of content is most conducive to each social network.

Error Considerations:

  • Depending on how your website is setup, if you are using UTM parameters you might not see any valuable data. Google Analytics is catching up in tracking social traffic from more and more providers. As of right now the most popular plugins, networks, and sources will be accounted for but the rest are not.
  • URL shorteners can give Google Analytics issues (bit.ly, etc.).
  • You have to add code to setup Social Plugins (see this page by Google).

Advanced Reports

Acquisition Reports Contain Social Focused Data

Note: Social reporting requires goals and setup.

  • Acquisition > Social > Overview
  • Acquisition > Social > Network Referrals
  • Acquisition > Social > Landing Pages
  • Acquisition > Social > Conversions

Question: Which landing pages have high bounce rates?

Why you might ask this question for your business:

  • You want to make sure that you are sending relevant traffic to your landing pages.
  • You want to make sure that your links to other pages on your landing pages are working.
  • You want to diagnose the landing pages that have weaker call to actions and improve them.

Error Considerations:

  • Landing pages are highly dependent on the quality of traffic being sent. When evaluating if a landing page is working you must consider the quantity and quality of traffic it is getting.
  • Always test; use the Google Experiments and A/B test changes to your landing pages with significant sample sizes to ensure you are improving in the right direction.
  • A broken ad or a broken link will sink a landing page, so ensure you are checking all elements of the landing page for issues.
  • Bounce rates can be deceiving. Depending on how you have defined a session, if interactions require hits, and other flash-based elements can display high bounces but in reality are not. When you see bounce rates above 80% or below 2%, double check them for bounce measuring issues.
  • Bounces are not the same as exits. A bounce is a single interaction where a user leaves the page they started on while an exit is the final page they leave on.

Advanced Reports

Behavior Reports Contain Landing Page Focused Data

  • Behavior > Site Content > Landing Pages (Secondary dimension: Source/Medium)

Question: Which landing pages have high conversion rates?

Why you might ask this question for your business:

  • You want to determine what is causing the landing page to convert so well.
  • You want to enlarge the offering of the high conversion landing page.
  • You want to make sure that you are not being misled by an error.

Error Considerations:

  • Landing pages are highly dependent on the quality of traffic being sent. When evaluating if a landing page is working you must consider the quantity and quality of traffic it is getting.
  • Always test; use the Google Experiments and A/B test changes to your landing pages with significant sample sizes to ensure you are improving in the right direction.
  • A broken ad or a broken link will sink a landing page, so ensure you are checking all elements of the landing page for issues.
  • Conversions are mapped back to goals, so the quality of the goal goes a long way to determining if a conversion was setup correctly. Also, goals can be based on events so you also have to determine if an event was setup correctly.

Advanced Reports

Conversions Reports Contain Goal Focused Data

Note: The Goal Completion Location is the page that converted, while the previous step pages are those that brought someone to that final page (this is where you look).

  • Conversions > Goals > Reverse Goal Path

BONUS

Question: How do my goals adjust based on the attribution model?

Why you might ask this question for your business:

  • You want to evaluate if a marketing channel is generating top of funnel awareness that leads to end of funnel goals.
  • You want to attribute content along the path toward a conversion.
  • You want to better understand the user journey.

Error Considerations:

  • Sampling galore. You are not getting 100% accurate data here because Google Analytics samples the data based on the raw data. While it has affinity to the raw data, it is not precise.
  • Cookies issues galore. Cookies wreak havoc for attribution. As people use more devices and browsers in their evaluation of products and services, these kind of issues will be more rampant.
  • Channels are part of the default groupings. Make sure you know what data is in each grouping before you make decisions based on this data. The data, at best, is directional.

Advanced Reports

Conversions Reports Contain Goal Focused Data

Note: You must have setup goals and it’s best to ensure they have been working accurately for 90-days prior to using this report.

  • Conversions > Attribution > Model Comparison Tool
    • Select a single conversion/goal.
    • Next to “Last Interaction” select a comparison model.
    • Select Conversions and Value to see event valued data alongside ROAS/Ad Spend.

That’s it! With a combined 15 possible questions and the Google Analytics Report to look at for each, feel free to bookmark this post (ctrl-d) and last week’s as your go-to guide. Or, download our PDF version here.

Now start collecting data through your Google Analytics reports!

Filed Under: Reputation Management Tagged With: Digital Management

The Top Reports to Look at in Google Analytics

October 3, 2018 by Kevin Dieny 2 Comments

Consistently improve your marketing with essential data. The best reports exist to answer a specific question tied to your marketing.

If you’re a smart marketer, you’re already using Google Analytics to aid in your marketing decisions. But sometimes Google Analytics reports can get overwhelming. It is easy to get lost in an array of data without knowing what to take away from it.

Looking for an easy guide of what report to look for depending on a specific question you are trying to answer? We’ve got you covered in this post!

What makes a report in Google Analytics Important?

All Google Analytics reports are important because they provide information on every user’s activities occurring on your organization’s website. But what makes a single report more important compared to another one is the value that you place on the information it provides.

The most valuable reports will be the ones that answer important questions you have.

Google Analytics reports are overkill for any business that does not have their important questions written down. Write down every question you want to be answered about your business and use this guide to try to find the reports that answer them.

Businesses have to start reporting on information tied to their plans.

Unless a plan is written down, it does not exist. If you operate a business without a plan, you will not succeed. You cannot measure success without knowing what success means. Write down your plan and then write down your questions.

Got a plan? Yes. Got your Questions? Yes.

Then let’s begin.


Question: How many people are visiting my website?

Why you might ask this question for your business:

  • You want to know the total universe of people that you are working with each month.
  • You want to measure the growth of visitors to your site to see if you are increasing the number of people visiting each month.
  • You are charged or use a paid tool that has a visitor limit, and you either do not want to hit the limit or want to know if you need to increase that limit before you hit that threshold.

Error Considerations:

  • People are not Users. Users or Visitors are the terminology Google Analytics uses to define when a unique Google Analytics cookie ID is created. This is not actually a person 1 to 1 but does tend to signify people because counts of people and counts of users are roughly close in number. When cookies are deleted, so is future data tracking.
  • Users are not shared across browsers or devices. When you visit a website from your mobile device, laptop, tablet, desktop, work computer, etc., those are all the different users according to Google Analytics. You should expect to see duplication of users across devices and browsers – there is no way around it in Google Analytics. User counts vary across time as well as cookies do not persist well the longer the time frame.
  • Your data is sampled. Unless you are on Analytics 360, your Google Analytics data is sampled. Sampled data means that you are not working with precise or accurate user counts.
  • You should consider setting up multiple views in your Google Analytics property so that you can filter out internal company visitors, agency visitors, and other data artifacts that contribute to user discrepancies.

Standard Reports

Audience & Acquisition Reports Contain Focused User Data

  • Audience > Overview
  • Acquisition > All Traffic > Channels

Question: How many people are returning to my website?

Why you might ask this question for your business:

  • You are a rock-star and are focused on measuring one aspect of retention.
  • You want to measure your growth of new and returning visitors over time.
  • You plan to create cohorts based on the sources that brought new people to your site and measure the visitor journey.

Error Considerations:

  • Conversions are most reliable if someone visits a page and converts immediately.
  • Somewhere between 1 – 7 days, conversion reliability falls prey to cookie issues and being lost to browsers and changed devices.
  • The conversion is still semi-reliable according to Google between 7 – 28 days.
  • Between 30 – 90 days, you are looking at highly sampled and issue-prone data.
  • Any tracking solution that uses cookies suffers from these issues. This is why you see a lot of attribution tools that use the 1-7 or 28-day windows.
  • When Google Analytics does not know if a visitor already exists, it marks them as new.

Standard Reports

Audience & Acquisition Reports Contain Users & New User Focused Data

  • Audience > Overview
  • Audience > Behavior > New vs Returning
  • Acquisition > All Traffic > Source/Medium

Question: How many web pages occur per session on average?

Why you might ask this question for your business:

  • You want to know how deep visitors go on your website, on average. If your website has a lot of indexed public facing pages, then this metric might matter a lot more.
  • You care less about quantities and care more about the engagement of your overall site in moving people into deeper links.
  • Deep linking or visitors clicking around on your site has a benefit to SEO.

Error Considerations:

  • While users suffer from duplication and are error-prone, sessions ignore this. Sessions are just grouped events by time and by interaction type whenever the cookie ID loads on site load. Site load can vary from pages loading, resources downloading, videos buffering, API calls or requests being made, etc.
  • Sessions tend to be far greater than users. Confirm that your sessions are scoped and time-limited to the appropriate limits in your admin settings. Do not compare your session data to another website because it will not be accurate.

Standard Reports

Audience & Behavior Reports Contain Sessions and Pageview Focused Data

  • Audience > Overview
  • Audience > Behavior > Engagement
  • Behavior > Overview

Question: What kind of devices are my visitors using to visit my website?

Why you might ask this question for your business:

  • You care about the customer experience on your website across devices.
  • You want to know what types of devices your visitors are using in order to segment them into audiences for retargeting on those same devices.
  • You want to identify devices that have high bounce rates and low conversion rates to see if there is an issue with your website using a specific device.

Error Considerations:

  • Devices are detected often by the size of the screen viewing the web page, but there are other indicators like mobile device ID that can be used to determine the type of device. Devices are what Google Analytics is confident about but still suffers from accuracy errors.

Standard Reports

Audience Reports Contain Users & New User Focused Data

  • Audience > Mobile > Overview
  • Audience > Mobile > Devices
  • Audience > Technology > Browser & OS
  • Audience > Benchmarking > Devices

Question: What marketing channels are driving traffic to my website?

Why you might ask this question for your business:

  • Your marketing involves multiple channels, and you want an overview of traffic from each of those channels.
  • You invest or spend money on promotional channels and want to measure the effectiveness of that marketing.
  • You want to measure retention of your audiences across channels.

Error Considerations:

  • Do not engage in channel wars. Comparing channels is a bad habit of organizations who diagnose the effectiveness of their channels using only limited metrics. Correctly comparing channels requires a robust attribution and lifetime value models to determine if a channel is performing well over time. Also, consider a channel that is not being utilized as well as it could be versus a channel that is just a bad channel for your business.

Standard Reports

Acquisition & Audience Reports Contain Channel Focused Data

  • Acquisition > Overview
  • Acquisition > All Traffic > Channels
  • Acquisition > All Traffic > Source/Medium
  • Acquisition > All Traffic > Referrals
  • Audience > Benchmarking > Channels

Question: What search engines are driving organic traffic to my website?

Why you might ask this question for your business:

  • You want to know which search consoles you need to add based on the search providers sending you organic traffic.
  • You plan to dive into the sampled queries provided to you by those search providers in their search consoles and find the queries you are popular for.
  • You want to know which search providers your audiences are using to find your website.

Error Considerations:

  • (Not provided) keywords occur because of the sampling of data in the search console. You can use the API or purchase a third party tool that can unlock a lot of the raw data and keywords for you from the queries. Consider that the results you find are sampled, therefore they are directional but not precise. You can still use directional data to help you move the needle.

Standard Reports

Acquisition Reports Contain Organic Focused Data

NOTE: You must connect your search console to Google Analytics for it to show up.

  • Acquisition > Campaigns > Organic Keywords (Change primary dimension: Source)
  • Acquisition > Search Console > Landing Pages (Add second dimension: Source)
  • Acquisition > Search Console > Queries (Add second dimension: Source)

Question: How much local traffic is my website getting?

Why you might ask this question for your business:

  • Your business relies heavily on local markets.
  • You want to see how effective your marketing efforts have been on producing local web traffic.
  • You want to ensure you are not getting too much website traffic outside of your marketable geography.

Error Considerations:

  • Locations are based on several sources of information gathered by Google. First, depending on the browser and HTML5, most modern browsers gather this information themselves, and it can be accessed. Second, devices gather this information and build the GPS out of the connection to the internet. Finally, Google can reference latitude and longitude from a variety of points of historical data and past searches. This is all combined and evaluated to determine the most likely position of someone’s location. The most accurate Google Analytics can be (according to this article) is 11.1 meters.
  • If you want to include store metrics like foot traffic, time in store, number of shoppers in store, etc., these analytics are outside the capabilities of Google Analytics.

Standard Reports

Audience Reports Contain Geographic Focused Data

  • Audience > Geo > Location (Select Desired Depths)
  • Audience > Geo > Language
  • Audience > Benchmarking > Location

Question: How quickly is my website loading?

Why you might ask this question for your business:

  • Site speed also correlates inversely with bounce rates – you want people to arrive on your site to stay and look around. But if it does not load quickly enough, they leave.
  • You want to determine if there is a specific browser that has issues loading your website.
  • You want to see if your CDN is having a noticeable impact on load speed.

Error Considerations:

  • Google Analytics has gotten a lot better at determining the average load speeds. There are circumstances where the evaluation is dramatically off based on the type of website. Requests play a large role, and these can be skipped giving a wrong impression of a site loading quickly when it does not. Also worth noting is the type of connection like a 2g, 3g, 4g, LTE, 5g, etc. that your users are on while using a mobile device will affect the load.

Standard Reports

Behavior Reports Contain Site Speed Focused Data

  • Behavior > Site Speed > Overview
  • Behavior > Site Speed > Page Timings
  • Behavior > Site Speed > Speed Suggestions

Hopefully, this easy guide has helped. Feel free to use this go-to guide whenever you need by bookmarking this page, or, download our PDF version here.

Stay tuned next week for answers to even more questions with our guide to advanced Google Analytics Reports.

Filed Under: Reputation Management Tagged With: Digital Management

The Importance of Digital Marketing: Experts Weigh In

September 27, 2018 by Cassie Ciopryna Leave a Comment

In today’s digital age, it is important to correctly attribute your digital marketing.

It is impossible in 2018 to have a complete view of your marketing data or your consumers’ journey without including digital attribution. Marrying all of your data to connect how consumers reach your business and where they get to your business from is important.

How are you tracking your consumers digitally?

No matter the method you use, find below quotes from some of 2018’s top digital marketers to learn more about why you need to make sure your digital marketing plan is on par with the data you need to make better decisions for your business.

“Whether you want to brush up on your skills or expand your learnings, there are several fundamentals every digital marketer must have on hand in 2018. The core foundation of digital marketing remains content, but oh how it’s evolved. Using a data-backed approach to create a seamless and personalized experience is critical.”

– Rebekah Radice
Keynote Speaker, Author, Marketing Performance Strategist


“Being involved in digital marketing is so exciting because of the ongoing changes to the industry. To be an effective digital marketer you need to drive measurable results for your company. As digital marketing is constantly changing we need to be open to learning, testing and improving. Your best tactics today may not be your best tactics tomorrow.”

– Ian Cleary
Founder of Razor Social


“There are numerous different aspects of being an effective digital marketer today; for one, you need to be strategic and plan your strategies ahead of time. You also need to be prepared to make changes to your strategies and plans at any moment; always check your analytics, understand them, and use them to optimise your strategy. And finally, an effective digital marketer knows tools: what the best ones are and what to use them for to help you save time & generate results.”

– Lilach Bullock
Online Business Expert, Speaker, Coach

What are you waiting for? Get started on improving your digital marketing presence today! And make sure you’re tracking it all appropriately.

Source: Brand24 Top 100 Digital Marketers 2018

Filed Under: Reputation Management Tagged With: Digital Management

9 Automotive Buying Trends: The Consumer Journey from the Internet to Vehicle Purchase [Infographic]

September 25, 2018 by Cassie Ciopryna 2 Comments

You won’t believe how car buying has changed in the digital age.

The car buying journey from inception to purchase has added a lot more steps since the age of the internet.

No longer do consumers simply walk into a dealership and purchase a car off the lot. Much more time and research has been involved, and you need to make sure that your dealership is keeping up with the digital needs of your consumers.

Check out these 9 fascinating facts below to learn more about how your consumers are finding their perfect vehicle through the internet.

Car Buying Trends - 1
Car Buying Trends - 2
Car Buying Trends - 3

2016 Car Buyer Journey Study 2018 Car Buyer Journey Study 2017 Netsertive Auto Buying Path Survey

Filed Under: CallTrack Tagged With: Call Management, Digital Management

Can I Use a Tracking Number in Google My Business?

September 24, 2018 by Cassie Ciopryna Leave a Comment

Google is not the enemy to call tracking – you can use them together.

Just as the digital world surpasses what we conceived imaginable as years and even days go by, so has call tracking.

Although call tracking is widely seen as useful for offline marketing, some marketers have had differing opinions on whether or not to use call tracking numbers in their online ads as well. Sure, most are able to use it on their website – especially with dynamic numbers available to track every consumer – but some specialists had concerns with using tracking numbers in other places. One of these places used to be Google My Business.

The good news is that this is no longer a worry for marketers. Swapping out your main telephone number for a tracking number, when done right, can increase your true Google My Business conversion data immensely.

Why do I need a tracking number in Google My Business when it already attributes my calls?

Well, although Google My Business does provide call attribution in the Insights Report, it only tracks click-to-call on mobile devices. While click-to-call is an incredibly useful tool, this data is incomplete. What about consumers that see the number on a desktop and dial from a different phone? Or even those who save the number for later and don’t click right through?

Besides that, the data in the Insights Report won’t manage dropped calls correctly either, while a robust call tracking system such as one that CallSource provides will illustrate all hang-ups, disconnected and dropped calls.

How do I add a tracking number to Google My Business?

  • 1. Log in to Google My Business.
    login-google-my-business

  • google-my-business-info-step1
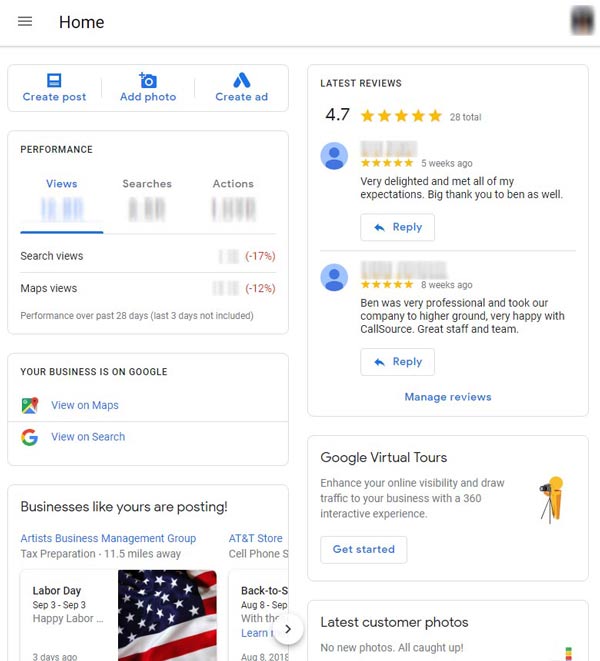
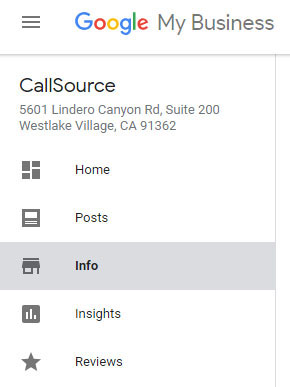
2. From the Google My Business dashboard, click on the “Info” tab to update contact information.

  • google-my-business-info-step2
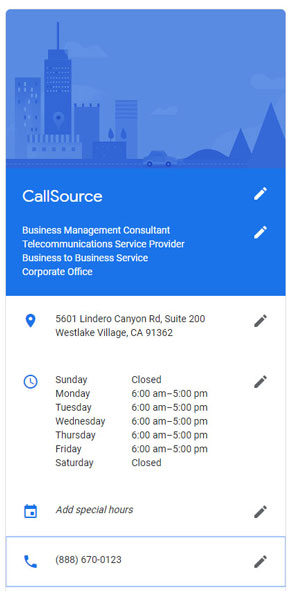
3. From the phone number section, move your main number (most likely the phone number that your call tracking lines point to) as the “Additional Number.” 

  • call-tracking-phone-numbers-google-my-business-step34. Make your call tracking number your new “Primary Number.”

That’s it! It’s quite simple.

You’re ready to track your Google My Business Calls

Now you will see a fuller picture by using a tracking number in Google My Business.

Not only will you gain more insight into the true amount of calls coming in through this listing, but you can also now receive your more robust metrics such as prospect reporting, appointment conversion reporting, and more that call tracking systems such as CallSource can provide to you.

Do you want to learn more about call tracking for your business? Contact a CallSource representative today.

Filed Under: CallTrack Tagged With: Call Management, Digital Management

  • « Previous Page
  • Page 1
  • …
  • Page 3
  • Page 4
  • Page 5
  • Page 6
  • Page 7
  • …
  • Page 9
  • Next Page »
CallSource, solutions for advanced call tracking, performance coaching & responsive customer service

More Information

  • Automotive Data Insights
  • Digital AI℠
  • Home Services Data Insights
  • Legal
  • MSA
  • Privacy
  • SAAS
  • Security

About CallSource

  • Blog
  • Careers
  • Contact Us
  • Events
  • Sitemap
  • Team
  • The Company We Keep
  • Your Source

Partners

  • Nexstar Network
  • AutoID
  • BDR
  • GM iMR
  • Sycle

Contact

5601 Lindero Canyon Road
Suite 210
Westlake Village, CA 91362

support@callsource.com
800-500-4433

Schedule a Demo

© CallSource. All Rights Reserved.